Positive and passionate about life. I'm looking forward to turning insights into reality and supporting the integration activities of multidisciplinary design projects.
Major project
Driver Hazard Perception in Automated Vehicle
Loughborough University Human Factor Research Lab - Driving Simulator
The study aims to investigate the driver's difference in hazard perception between manual vehicles (Level 1) and in automated vehicles (Level 3). The study was carried out in a simulated environment (driving simulator), to determine the impact of driving a vehicle with different levels of automation on driver hazard perception by comparing the physiological and behavioural differences between the two driving environments through simulated driving, then provide recommendations for the training of automated drivers.
Experiment procedure
The experiment design provided each participant with an opportunity to drive a car simulator. Participants were asked to sit in the car, the first step was to adjust to the participant's comfortable primary driving position. The participants were then given one minute in manual driving mode to familiarise themselves with the driving environment. After one minute, group 1 participants remained in level 1 manual driving mode. They would first experience the motorway driving environment for 6 minutes and then move on to the city driving environment. After the simulated drive, a memory test was carried out on the screen. group 2 participants were asked to carry out the same steps as group 1 for the first minute of the experiment and after one-minute group 2 participants were prompted to enter automatic driving mode, but could take over the vehicle if necessary.
Video recordings
Camera 1 is used to record the user's actions and the time the user takes his eyes off the road. Camera 2 is used to record the number of times the user applies the brakes and the time he applies them.
The number and the time of brakes
By analyzing the data from videos, the number and the time of brakes can be known. On average, level 1 drivers applied the brakes 12 times more often than level 3 drivers in the motorway environment. In the city environment, level 1 drivers applied the brakes 9 times more often than level 3 drivers.
Boxplot - the difference mental stress in level 1 & level 3 driving modes
The mean value of psychological stress for drivers in a level 3 driving environment is greater than the mean value of psychological stress for drivers in a level 1 driving environment.
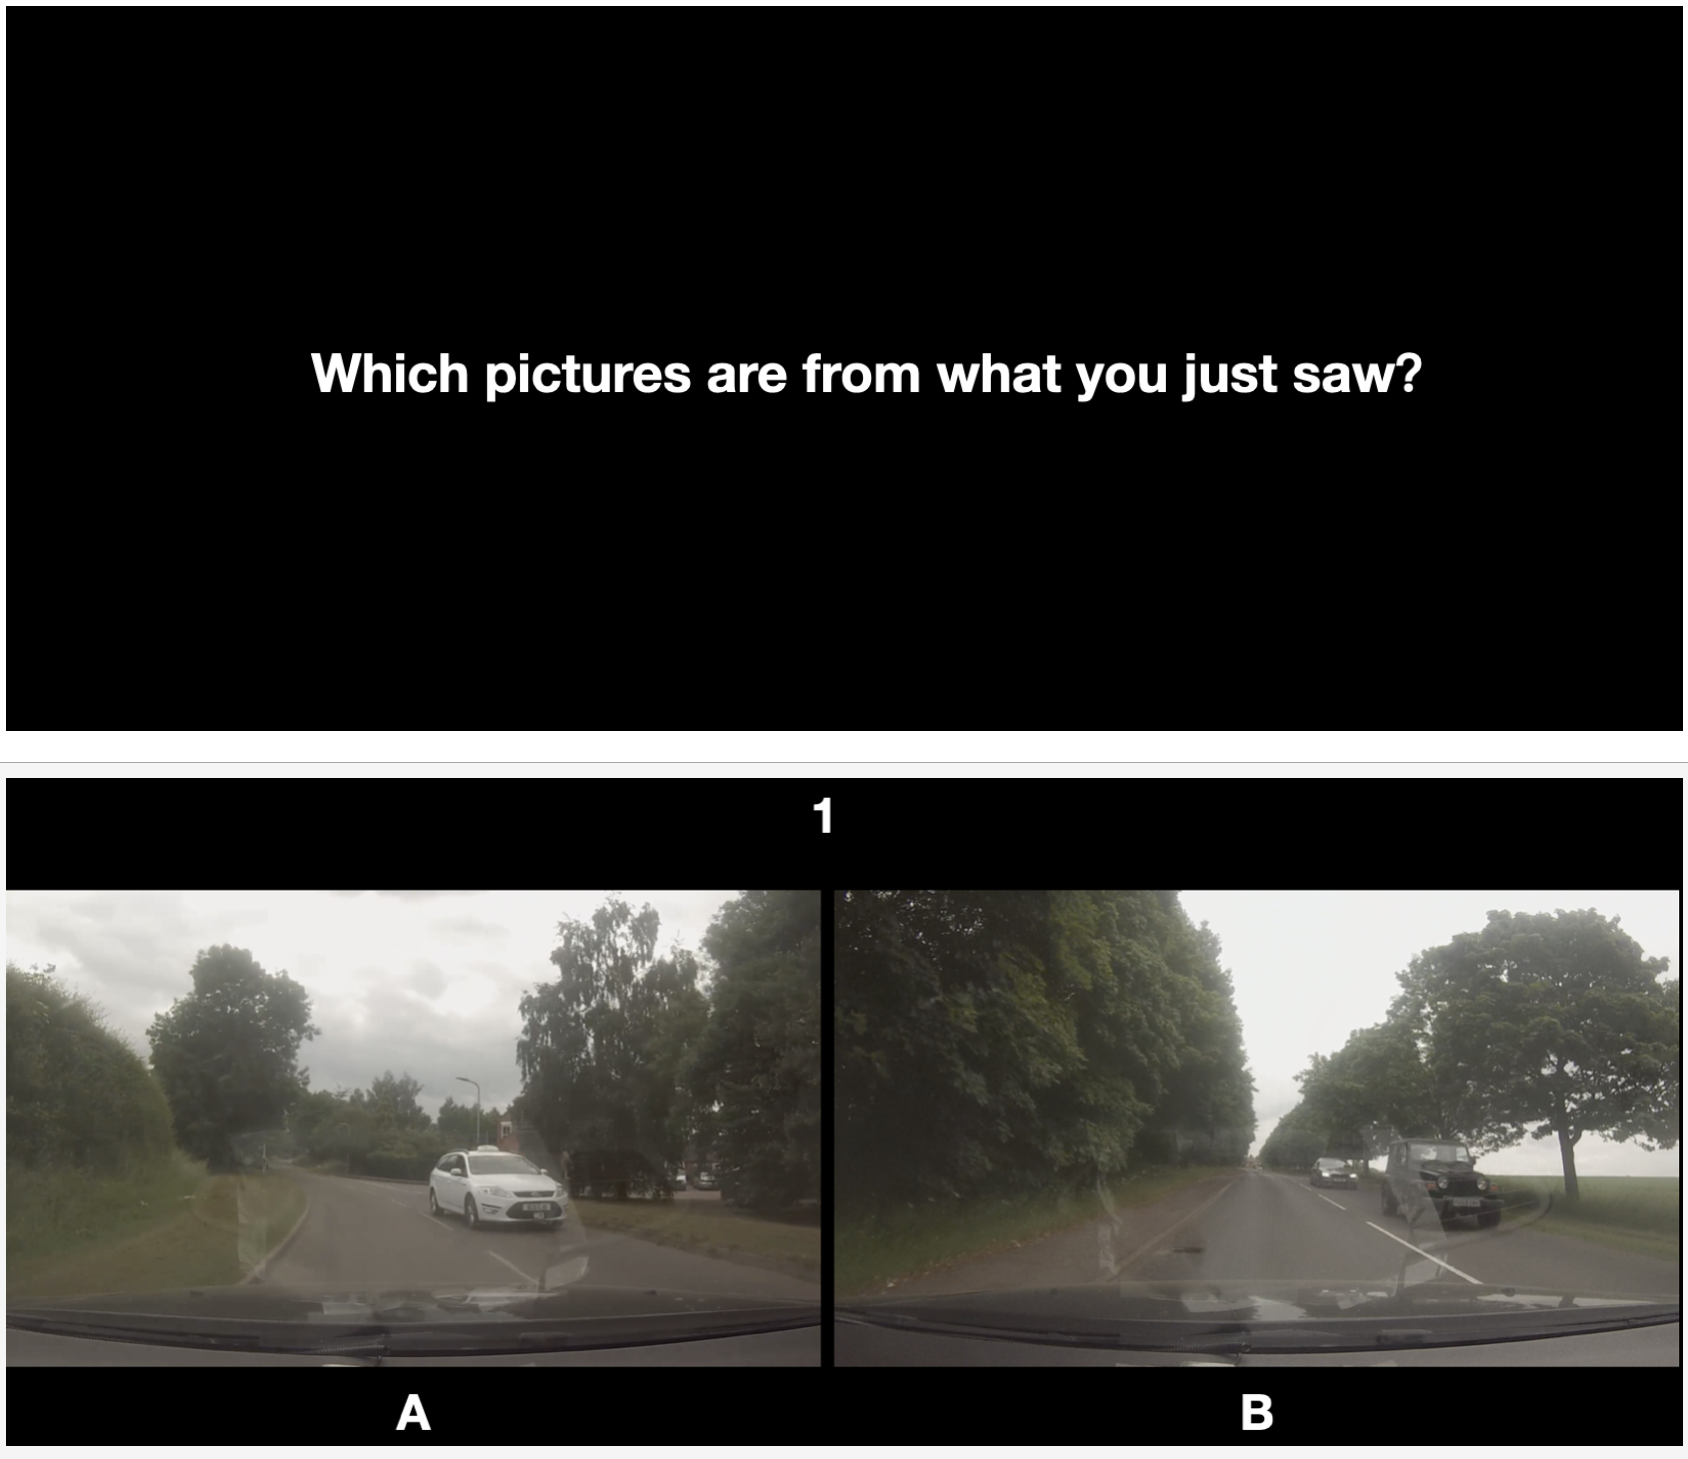
Memory Test
Six images of the driving environment were selected by counting the number of hazards identified by the four users. The six similar images were selected from other videos and six were from the test video. Each image contained three or fewer risks. The hazard factors were kept maximally consistent across the six sets of images, as shown below, with the two sets of images in blue for different risks.
Xinran Zhang
Major project
Driver Hazard Perception in Automated Vehicle
Work Experience
Company: Zhejiang Fire Maple Outdoor Products Co., Ltd. / Product Designer
08/2020 - 06/2021 China
1. Responsible for the development of new products for camping equipments.
2. Experienced in working closely with market, design and manage teams.
3. In-depth understanding of the product development and iteration process.
4. Five of the products designed have been marketed and the remaining three are in the development stage.


